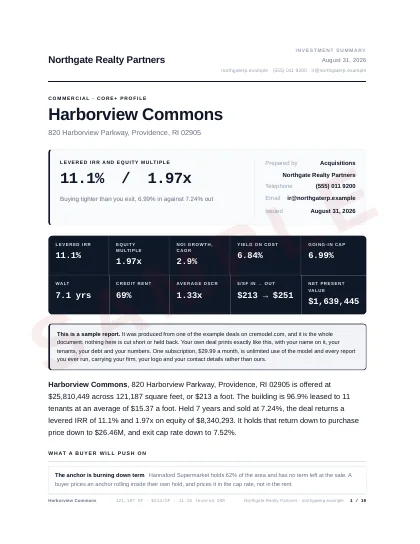
Sample report, PDF →

OMAI Scan · $29.99 a month in the pilot, ten reads · cancel any time

Commercial real estate modeling of the future. No install, no demo, no loading bar: sign in and the model is already open.

Signing you in

One moment. The link is being checked and the model will open.

Commercial real estate underwriting

Hours of data extraction, in minutes.

OMAI Scan reads the broker’s book into a live underwriting model, every figure tied to the page it came from. Then sensitize anything: price, exit cap, rent, vacancy, the cost of debt. The returns re-run as you type, and the report prints in the order a committee reads.

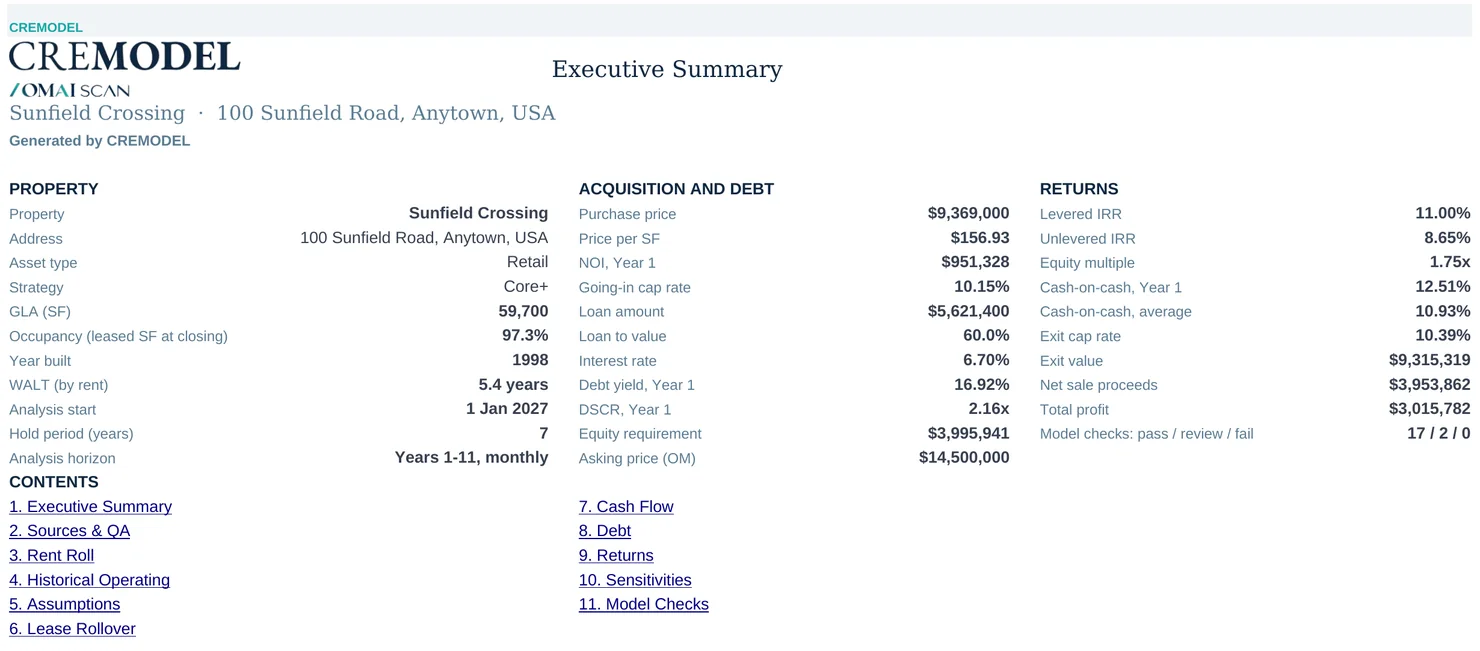
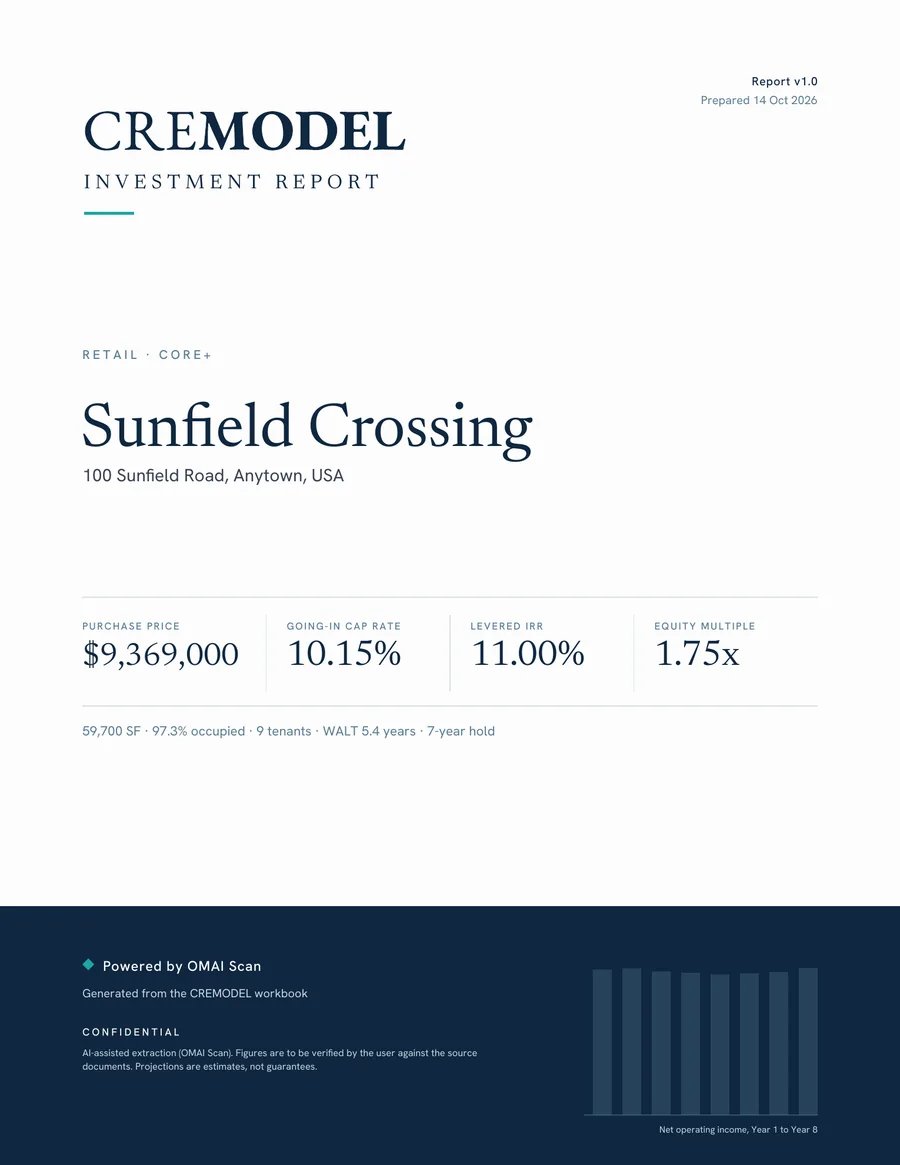
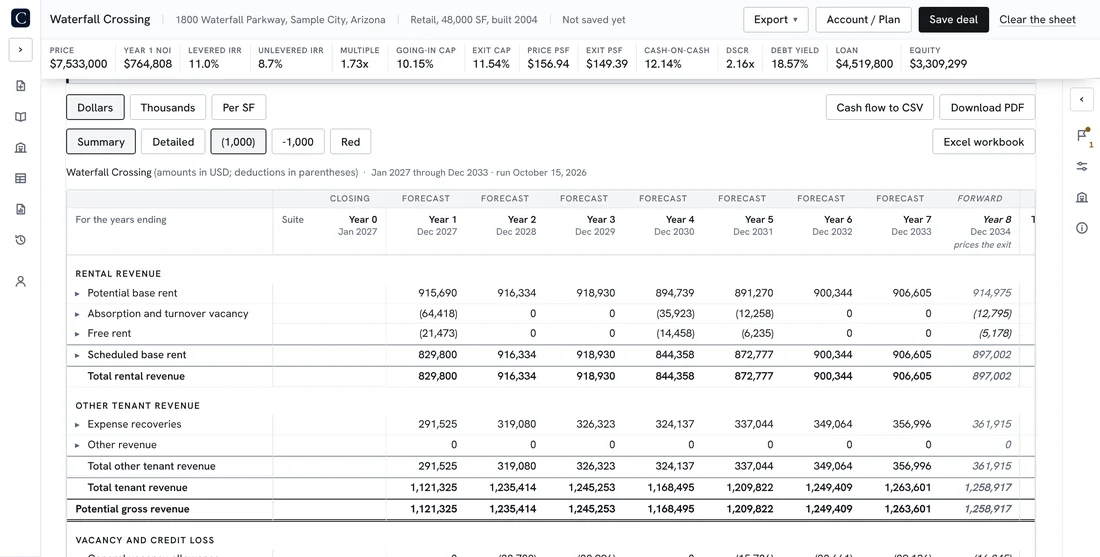
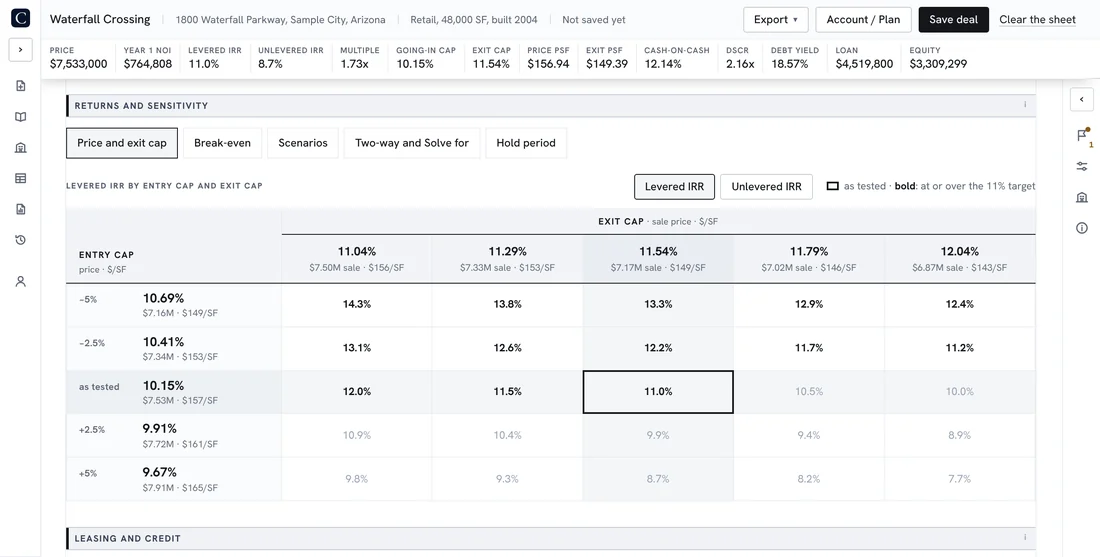
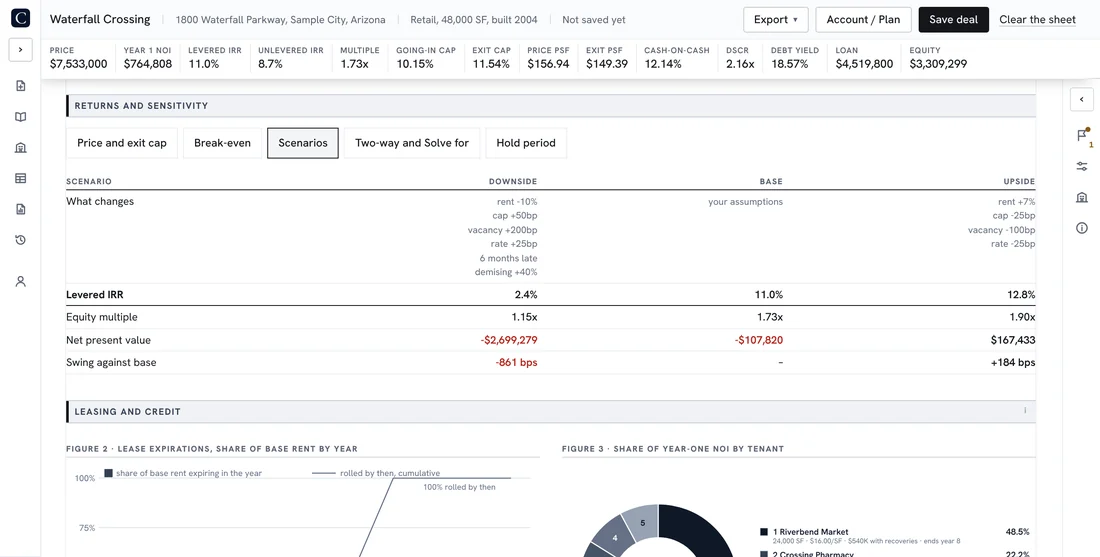
The sample deal, Sunfield Crossing: real pages from the sample workbook and report.
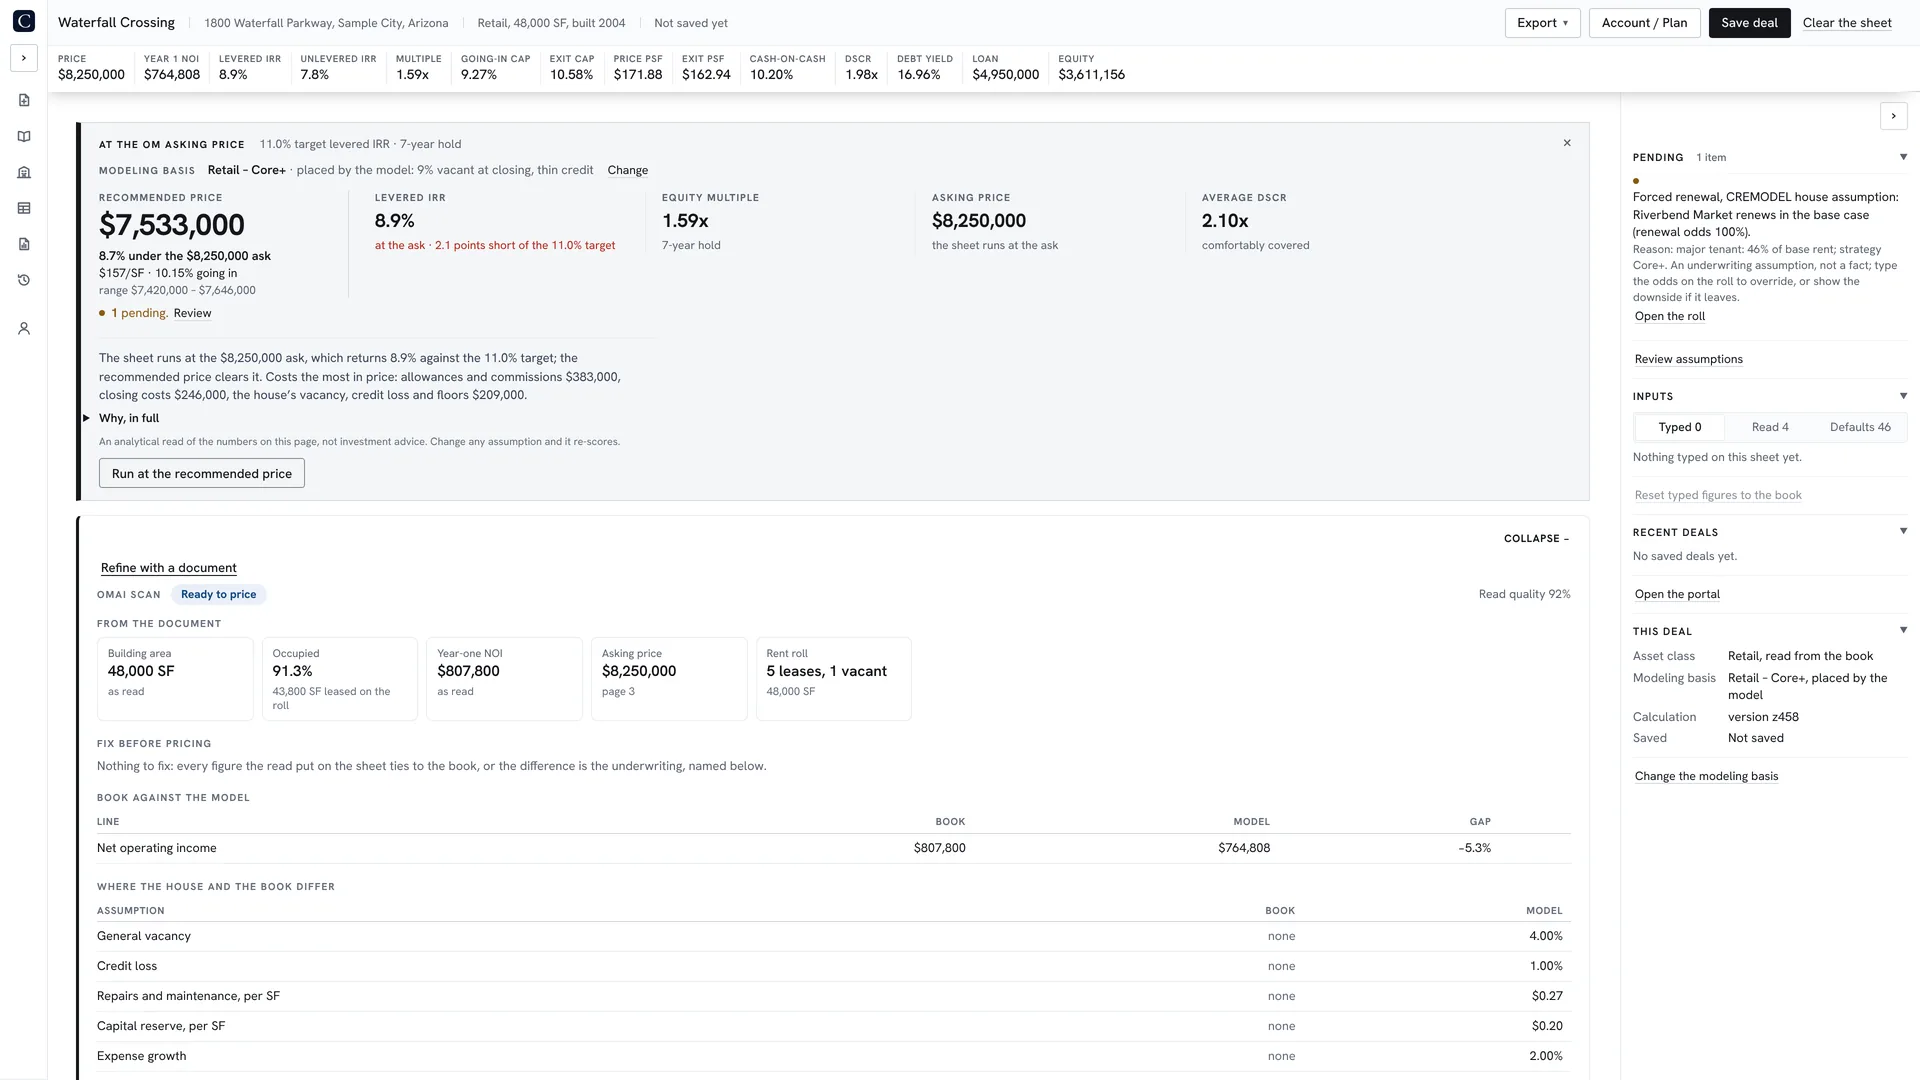
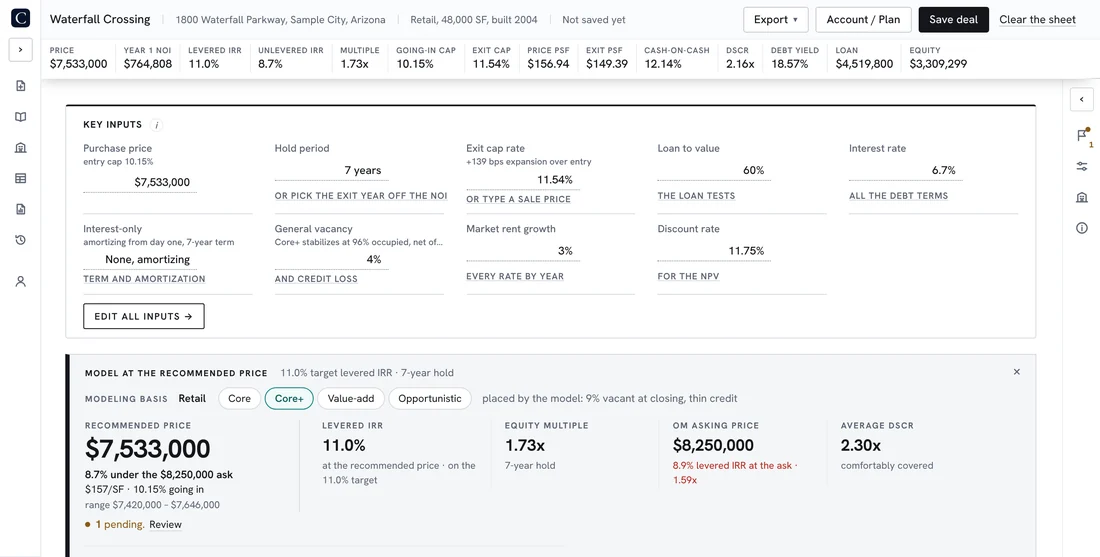
The model page on a sample deal: the metrics across the top, the summary and the returns at the asking price
The model page in a minute: the book read in, the price recommended, the ask tested, the exit cap moved and the report printed. Every number is a cell you can move.

Not a chatbot. A reader built for underwriting.

An AI chatbot will read the book and write you an answer. OMAI Scan reads it in passes, checks its own arithmetic against the pages and fills a live model: CREMODEL’s reading and reconciliation code on a third-party AI model, improved with every build. Every figure it writes is tied to the page it came from; what the pages do not say is left blank, never guessed.

7
passes on a book: triage, the rent roll, the expenses, extraction, review, verification and a verdict
30+
arithmetic screens on every read: rent times area against the annual, the book’s totals that must tie
160+
model inputs filled from one read, each with the page it came from
150+
automated checks on every build of the reader and the model

Why not paste the OM into an AI chatbot?

Pasting the OM into an AI chatbotOMAI Scan in CREMODEL
What comes backAn answer written out, in whatever shape it arrivesA live model. Every figure a cell you can move
The arithmeticWorked out again each time you askOne fixed engine, the same on every deal
Checking the readYours to check, line by line, against the book30+ arithmetic screens a read. What it could not read is left blank
Where a figure came fromYours to find again in the bookThe page it came from, beside the figure
SensitivityAsk again, then compare the answers by handGrids in basis points, scenarios, where the deal breaks
You leave withText, and the job of moving it somewhereAn investment report and an Excel workbook, on your letterhead
The next dealDescribed again from the startYour house standard, saved, versioned, applied
After closingThe conversation is goneThe building tracked against its underwriting, year by year

One book in. A deal ready to sensitize for pricing.

1

OMAI Scan reads the book.

The rent roll, the leases, the operating statement and the price, read in passes and tied to their pages. The totals must tie; what the pages do not say is left blank, never guessed.

In a CREMODEL account every read becomes the full model; with OneTime OMAI Scan, one OM becomes an Excel model and a PDF report.

CREMODEL’s own reading code on a third-party AI model, feeding 160+ inputs.

2

Every assumption, a cell you move.

The returns re-run as you type. One house standard carries your growth, vacancy, leasing cost, loan sizing and exit into every deal, so two analysts arrive at the same answer.

3

On your letterhead, in committee order.

The investment report in the order a committee reads it, on your firm’s letterhead, and an Excel workbook with live formulas and every assumption in it. See the sample report.

4

Saved, shared, and tracked after closing.

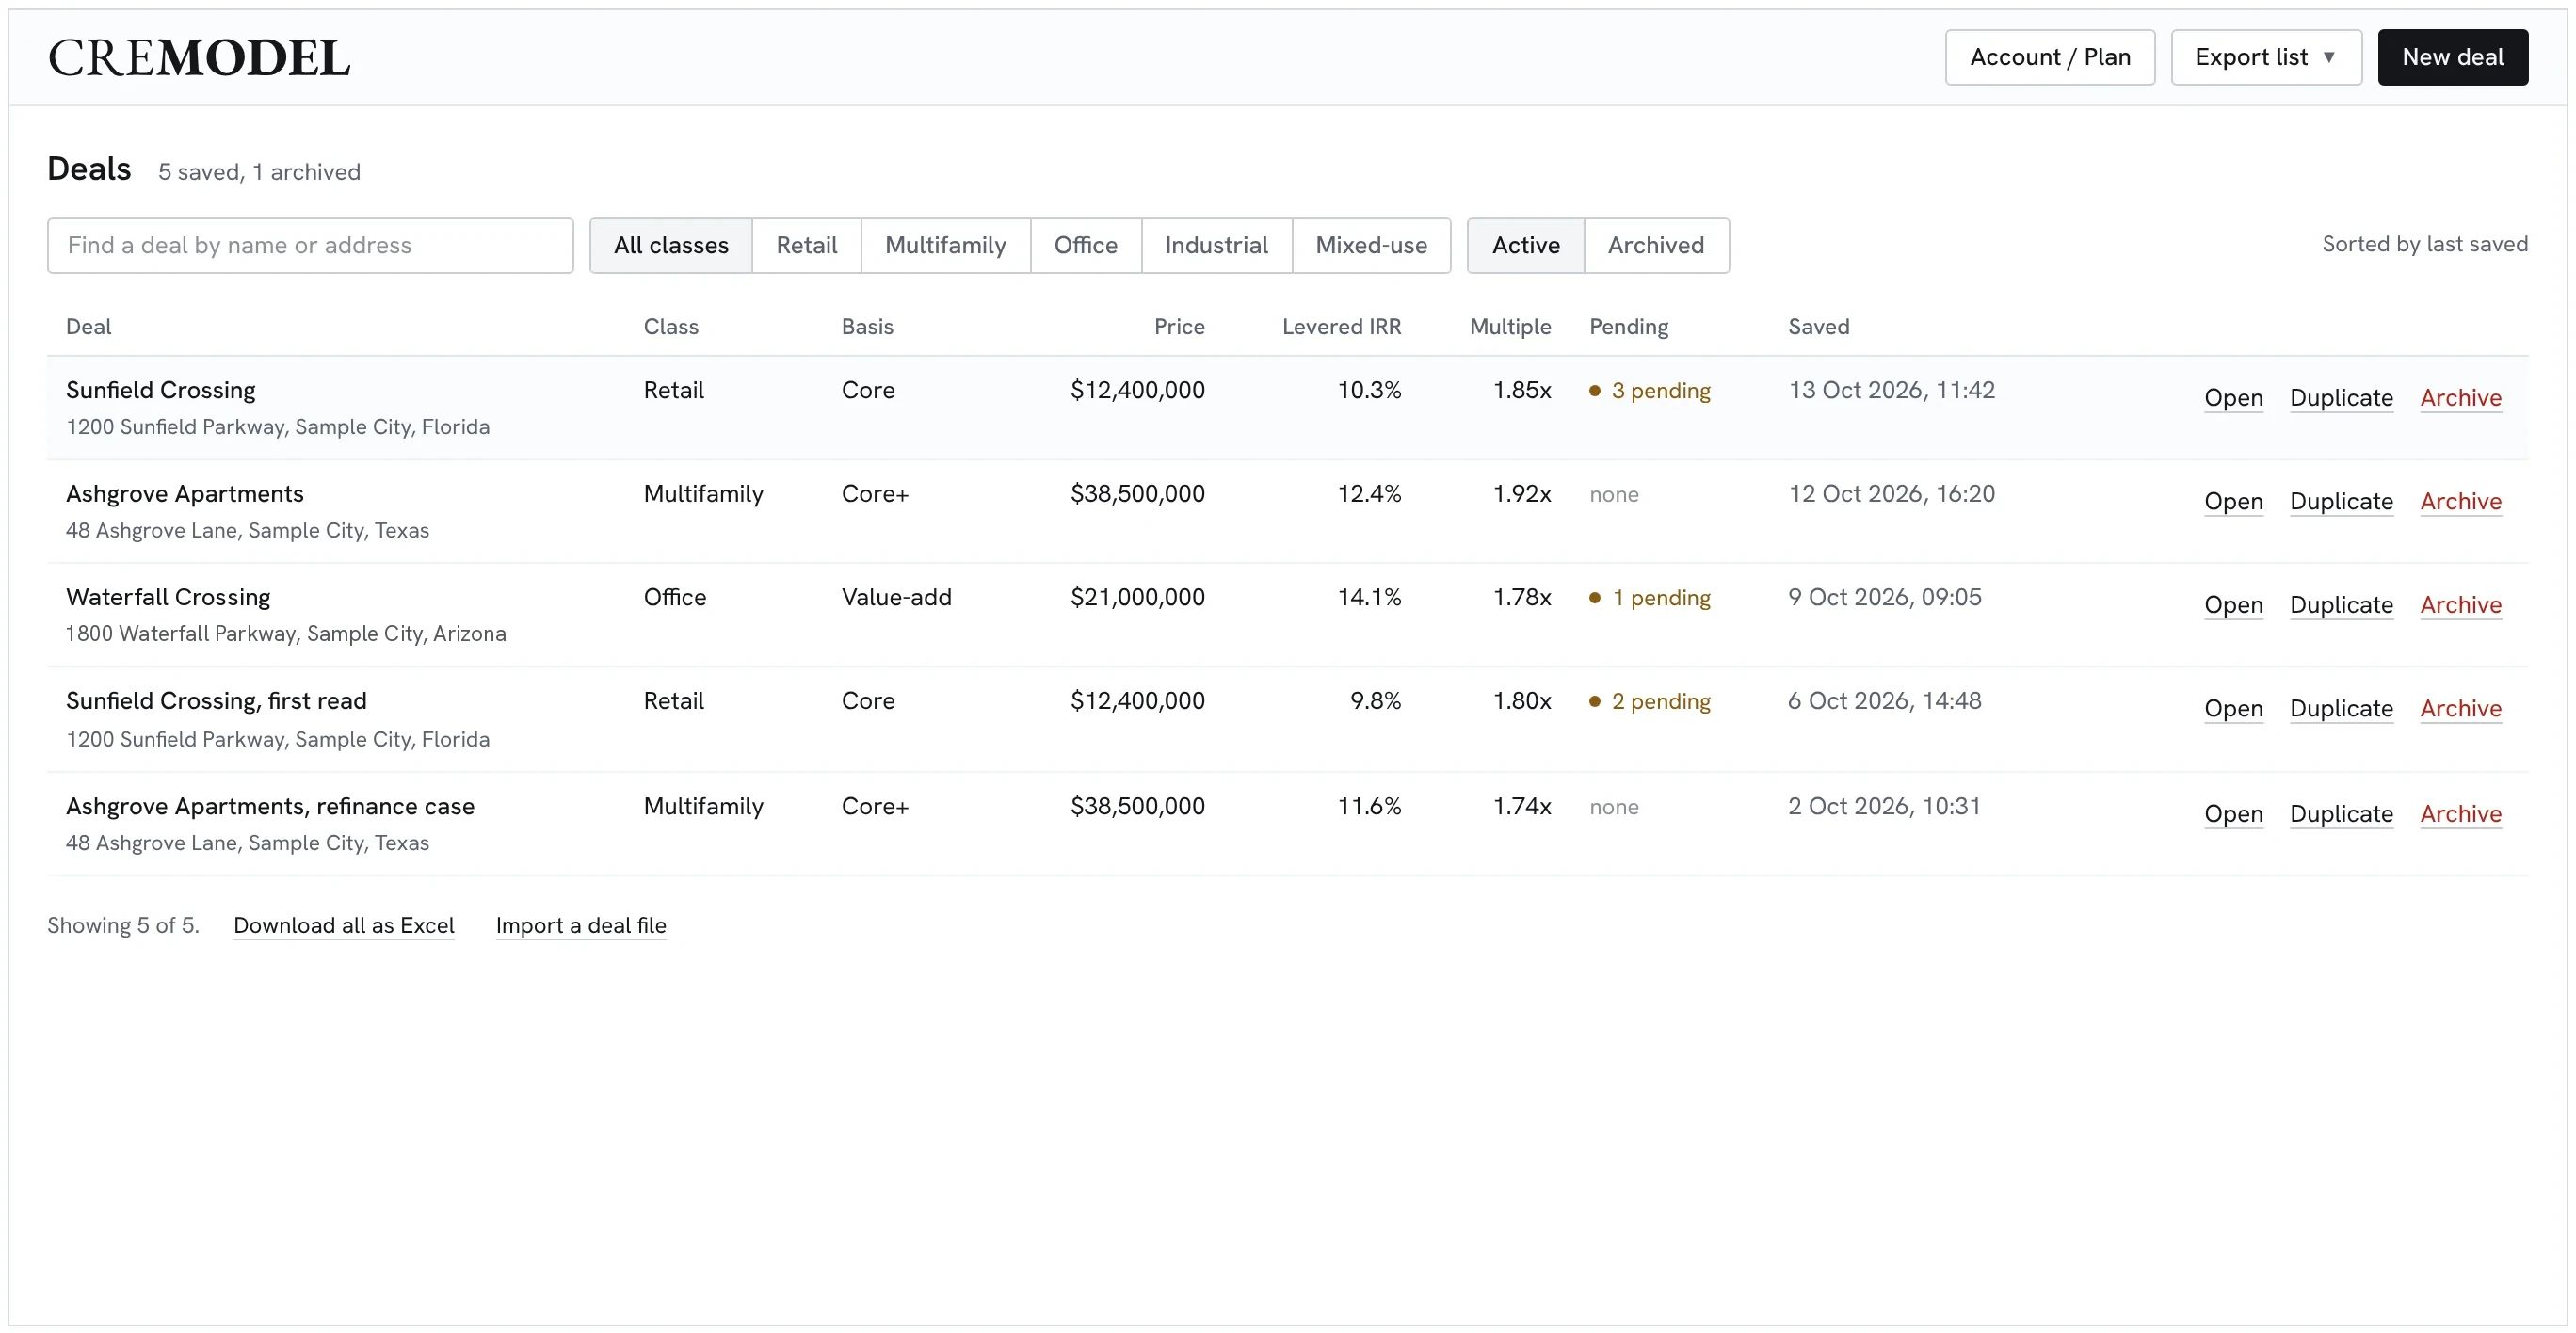
That is the CREMODEL account. Every deal you read is saved in your portal and versioned each time you save it, with its notes and a history of who changed what, and when. The pipeline shows each deal’s price, levered IRR and multiple; from it you open a deal in the model, print its report, download its Excel, share it with your team or archive it. After closing, each building is tracked against what you underwrote, year by year.

One deal, no account? OneTime OMAI Scan reads one OM into an Excel model and a PDF report, and that is it: nothing is kept in a portal.

What a committee asks for is already there.

On the sheet

Rent rollLease by lease: rentable area, contract rent and escalations, expiration, term and options, each figure with its page in the book
RolloverRenewal probability by tenant, with downtime, free rent, tenant improvements and leasing commissions on renewal and on re-leasing; forced renewal shown as an assumption where the Core thesis depends on it
RecoveriesExpense recoveries by lease structure (NNN, modified gross, gross) for taxes, insurance and CAM, with caps, base-year stops and gross-up
Cash flowInstitutional accounting hierarchy, Potential Base Rent through Cash Flow Before Debt Service, every tenant a line, the sale priced on the forward year’s NOI
DebtLoan sizing on the binding constraint of LTV, LTC, DSCR or debt yield, with the amortization schedule and coverage tested year by year
ReturnsLevered and unlevered IRR, equity multiple, NPV at the discount rate, yield on cost and cash-on-cash, reconciled to the equity cash flow
SensitivityTwo-way grids on price, exit cap rate, market rent, vacancy and the cost of debt, stepped in basis points, each cell a full re-run of the model
ScenariosNamed cases in one line (“exit cap +25 bps, market rent +5%, rate 7%”), including the major-tenant non-renewal downside
WaterfallDistribution waterfall: preferred return, return of capital and promote through each hurdle, with LP and GP cash flows
Credit, WALTTenant credit read from the book and classified, weighted average lease term by rent and by area, both yours to override

Underwriting notesGrocery-anchored centers · Strip centers · A vacant pharmacy box · Mixed use · Multifamily · Land and build

Pricing

Every deal, or just this one.

A CREMODEL account keeps every deal and the model behind it. OneTime OMAI Scan turns one OM into Excel and a PDF, and that is it. Accounts are coming soon, at a pilot rate for the first 50.

Individual account
$29.99per month
  • Keeps every deal, saved and versioned, in the portal
  • The model on the website, and in Excel when you want it
  • Unlimited investment reports, on your letterhead
  • Tracks each building after closing, against what you underwrote
OMAI Scans
10 a month; 5 more for $15, any time
Term
Month to month, canceled from the portal
Create an account · $29.99 a month

Already have an account?

Payments are taken by Stripe; no card number reaches this site.

OneTime OMAI ScanOne project
Pay per deal
OMAI Scan
One OM, read once
  • An Excel model to work in, and a PDF Investment Report
  • Sensitize in Excel, upload it back for a matching PDF
  • No account, no subscription. That is it.
Scan one OM

Your card is charged only when your files are ready.

Firms: seats for a team, one house standard and one pipeline shared across it. Write to contact@cremodel.com.

CREMODEL · commercial and residential underwriting


On a phone. The whole model is here: every section from the menu, every input, the cash flow and the summary first. The report and the Excel come from the saved deal in your account; a wide screen still shows more at once.

Upload the offering memorandum and let OMAI Scan, our trained AI analyst, read it. The rent roll, the expenses, the debt and the exit land on the sheet tied to the book, in a tenth of the time it takes to type, ready to sensitize. OMAI Scan reads the book so you do not type it. Upload the offering memorandum and our trained AI analyst builds the model, tied to the book, in a tenth of the time, ready to sensitize. On the OMAI Scan plan.


Cap Rate Calculator

What the property returns before any debt.

Cap rate

--

What the same income is worth at different cap rates

Value sensitivity

Base case outlined. Columns to the left are downside cases.

How it got there

Gross rent--
Less vacancy--
Less operating expenses--
Net operating income--
Value at your market cap rate--
Versus your price--

The ratios a lender or appraiser will run

Effective gross income--
Operating expense ratio--
Gross rent multiplier--
Break-even occupancy, unlevered--
Every 25 bps of cap movement--
Not in here: mortgage payments, depreciation and income tax stay out on purpose. Cap rate measures the property, not your financing. To bring debt in, run debt coverage or levered returns.

All eleven models

Start anywhere. Every model runs on numbers you type and a rent roll you can edit, answers immediately, and prints as a clean report with your deal name on it. Nothing is sent anywhere unless you choose to save a deal to your account. Press Copy deal link and the whole set of assumptions travels in the URL.

Debt Service Coverage

Does the income cover the loan payment? First thing a lender checks.

DSCR

--

Net operating income--
Annual debt service--
Cash left after the loan--
Monthly payment--
Break-even NOI--
Interest-only payment--
Room before you breach 1.25x--

The other two tests a lender runs

Debt yield--
Loan constant--
Implied cap rate needed to break even on debt--
Occupancy at which coverage hits 1.00x--
Debt yield is NOI divided by the loan. The return a lender would earn if it foreclosed tomorrow. It ignores rate and amortization entirely, which is why it became the post-2008 backstop: 10% is a common floor, and it is the one test a low rate cannot flatter. The loan constant is annual debt service divided by the loan. If your cap rate sits above the constant, leverage adds to your return; below it, leverage subtracts.
Reading it: 1.25x is the common lender floor on stabilized commercial, 1.20x multifamily, 1.30x–1.40x on riskier types. Below 1.00x you are feeding the property out of pocket.
On interest-only: an IO period flatters coverage because you are paying interest and nothing else. Most lenders still test the deal against the amortizing payment, so watch the "after IO" figure. That is the ratio you have to live with once the period burns off, and it is where IO deals get into trouble.

Max Loan Size

Sized by DSCR and by LTV. The lender lends the smaller one.

Maximum loan

--

Constrained by income vs constrained by collateral

Constrained by DSCR--
Constrained by LTV--
Constrained by debt yield--
Sized on interest-only--
Loan proceeds--
Cash to close--
Annual debt service--
Cash flow after debt--
Resulting DSCR--
Resulting debt yield--
Loan constant--
Why two numbers: when rates rise, DSCR usually becomes the binding constraint and the loan shrinks even though the property hasn't changed.
Interest-only sizing: a lender who tests coverage against the IO payment will lend meaningfully more, because there is no principal in the payment. Most size on the amortizing constant and grant IO separately, treat the IO number as the optimistic case, not the quote.

Levered IRR

Cap rate ignores your loan. This is what your own money earns.

Cash-on-cash

--

Unlevered vs levered vs total return

Net operating income--
Less annual debt service--
Cash flow before tax--
Down payment--
Closing costs--
Loan fee--
Total cash in--
Cap rate, no debt--
Total return with principal paydown--
Cash flow once IO burns off--

Over the full hold

Exit value--
Unlevered IRR--
Yield on total cost--
Levered IRR--
Equity multiple--
Net present value--
NPV versus IRR: IRR tells you the rate; NPV tells you whether the deal beats the return you actually require, in dollars. A positive NPV means the deal returns more than the discount rate you entered. Two deals can share an IRR and have very different NPVs if one puts far more money to work. Sale is shown net of your sale broker fee plus 1% closing.

Debt service coverage by year

Amortization schedule

Coverage and amortization. Coverage shows whether each year clears the lender’s floor; the schedule shows the balance outstanding at sale. An interest-only period improves the former and leaves the balance unchanged.
Leverage cuts both ways: when the cap rate sits above the loan constant, borrowing lifts your return. When it sits below, common at today's rates, leverage drags it down.

Enter the income, the operating expenses and the debt; the model returns the levered and unlevered return, the annual cash flow and the exit. It underwrites retail, office, industrial, multifamily and mixed-use assets, lease-up and ground-up development. Every assumption is an input cell, and the model recalculates on each change.

Start from a template

Blank gives you an empty sheet. Each template fills the whole model in: rent roll or unit mix, allowances, market leasing profiles, capital plan, reassessment and a loan. Then change whatever you like. This only sets the numbers you begin with; the model itself is the same one every time.

Rent roll

Rents quoted West Coast documents quote monthly; the model stores annual either way

Lease timing Type 03/2031 as a date; in-place leases open at the analysis start

Reading the sheet a cell on a dotted hairline is yours to type over; every plain figure is calculated from them

Click a tenant to open its card. Bump 10 every 5 yrs is a step lease; bump 3 every 1 is ordinary escalation. Sales and percentage rent feed the recovery and cash flow tables below.

Lease terms by suite

Levered IRR / Equity multiple

--

Market leasing profiles

What ARGUS calls market leasing assumptions. Set the terms once per kind of space, inline shops at 75% renewal, $25 TI and a 5% commission, anchors on their own numbers, then point each tenant at a profile from its card above. A lease that rolls takes its downtime, market rent, TI and commission from here, weighted by its renewal probability. These profiles are the only place downtime, free rent, the renewal allowance and the commissions are set: there is no sheet-wide figure to keep in step with them.

Recovery structures, for renewals and new leases

Name the way a lease bills its expenses once, then pick it on a market leasing profile as the renewal or the new-lease recovery. A renewal is billed on it for the share of the space that renews (the profile’s or the tenant’s renewal odds) and a new tenant for the rest, from the same probability-weighted start, and nothing is billed while the space is dark. A base year resets to the year the new lease starts; a renewal keeps the old one only when its profile says so. Without a structure a renewal bills as the lease in place and a new tenant as the market for the property: NNN at its full share for retail and industrial, a base year for office.

Apartment profiles, by unit type

One profile per kind of unit, and it carries what an underwriter sets by type: the market rent a new lease signs for today and how fast it moves (blank takes the sheet's Market rent inflation), the days a unit sits dark on a turn and what the turn costs in make-ready, commission and free months, the renewal probability when a lease ends, the step a renewal takes (blank renews half way to market, a rate renews at that rate a year and never past market), other income per unit a month, the renovation cost, premium and downtime for that type, the lease term the doors roll on when a row has no lease end, and the model, office or employee units of the type that earn no rent. A unit row finds its profile by the name in its Profile column, then by its own type name, then by bedroom count; a figure typed on the row wins over the profile, and a blank profile cell falls to the sheet's Renewal probability, Turnover, Other income and Renovation inputs.

Apartment fees and utility billing, item by item

Utility billing (RUBS) as a share of what the owner pays for water and sewer, trash, gas or electric, and fees per unit a month: parking, storage, pets, technology, amenities, the billing company’s own fee. Each is collected from the occupied units, so vacancy, turnover downtime and lease-up take their share, and bad debt applies, unless the row says otherwise. Units on their own meters pay the utility company, not you: leave RUBS off and the owner-paid utilities above at what the owner pays. RUBS are utility reimbursements and fees are other income; neither is a commercial recovery.

Development

Land you are buying, or a pad you are adding to a center you already own. A row here is a tenant like any other. It just costs money to build first and adds its square footage to the building when it opens. Set the month it delivers and the rent starts then. The build cost, the allowance and the commission go into your basis and your loan at closing, which is how a screening pass treats them before there is a draw schedule to model.

Residential unit mix

One line per unit type. Restricted units grow slower and turn over far less than market units, and lumping them together overstates both the income and the churn. Leave this empty on a deal with no apartments in it.

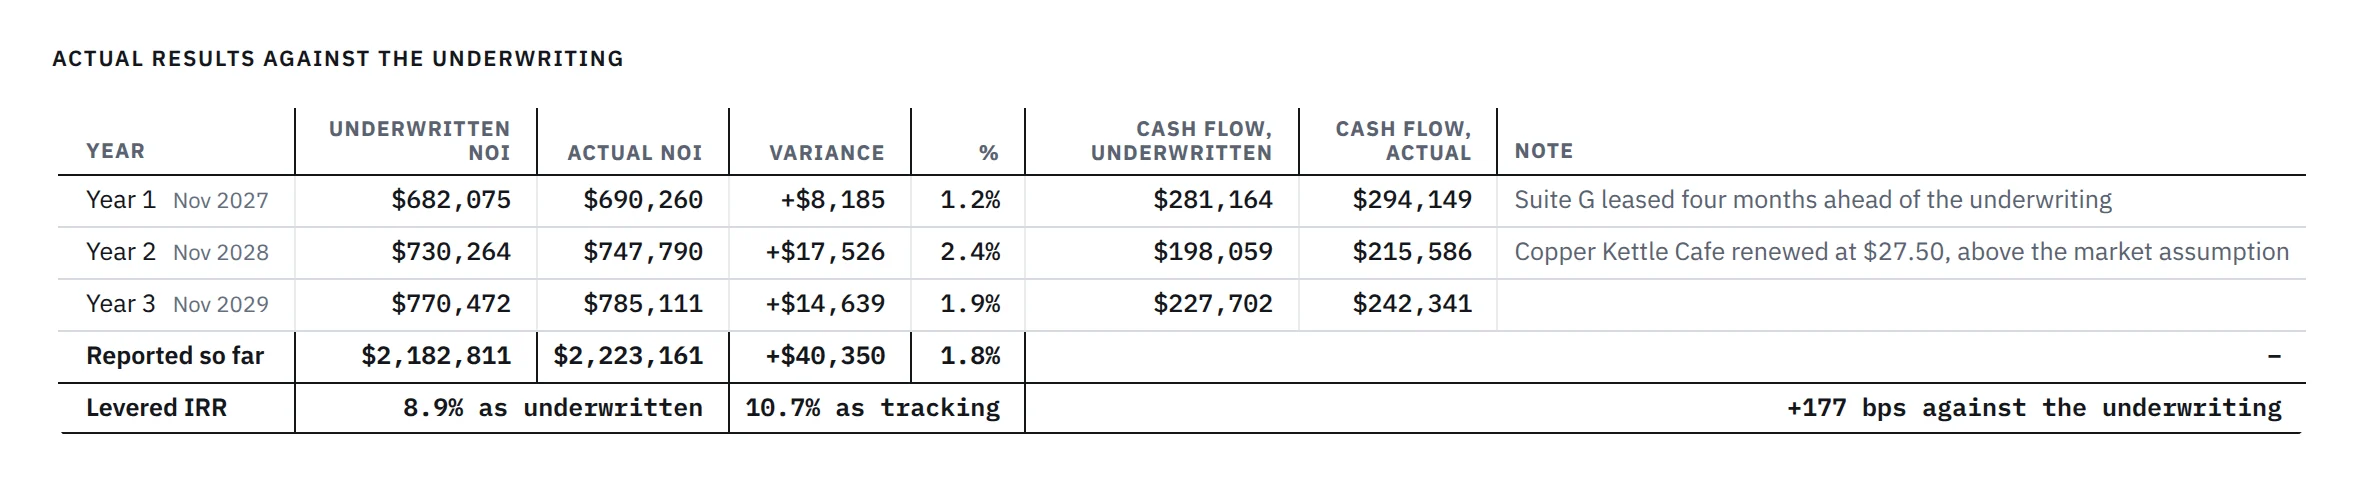
Actual results against the underwriting

Once a year is in the books, put the real numbers in. The model keeps its forecast for the years that have not happened yet, so you always have two answers side by side: what you underwrote at closing, and what the deal is actually tracking to. A tenant signing above your assumption in year five shows up here.

Building expenses split between the retail and the apartments

Expense changes by year

Taxes up 10% in year three. The electricity contract rolling off in year two. Insurance repricing after a storm year. Pick the line, the year and either a percentage change or the figure it becomes, and say whether it sticks or is a one-year event. Everything else keeps compounding at the growth rates above.

Expense classes: recoverable, variable, controllable, pool

One row for each expense line that does not bill the way the sheet assumes. Recoverable is the share any lease can be billed for (roof and structure work the landlord keeps, say 60% of repairs); varies with occupancy is the share that falls when space is empty, and only that share is grossed up; a line under a cap is controllable; the pool is who shares the line and whose area divides it (the shops without the anchors, the office floors apart from the retail). Lines without a row keep the sheet’s settings: every CAM line recoverable, the share of CAM that varies above, snow and common utilities outside a cap, one pool for all tenants.

Capital projects, item by item

Six rooftop units in year four, roof sections in different years, a seal and stripe that comes round every five. Year zero funds it at closing instead. To pass an item through to the tenants, set the share billed to CAM, the years it amortizes over (blank or zero spreads it over ten, the useful life most leases use; type 1 to bill it the year it is spent) and any interest the leases allow; the charge joins the CAM pool for the tenants named, so each lease's type, cap and exclusions still apply. The cash leaves in the year it is spent.

Below the line: one-off and recurring items

Cash that is not rent and not an operating expense: a termination fee a tenant pays you, a lease buyout you pay, a land sale, a settlement, an easement payment, an annual ground rent or franchise fee. Money in as a plus, money out as a minus. Set the year it lands; set every 1 yrs for an annual item, 0 for a single payment. Up to ten lines. Each one rides its own line of the cash flow below NOI, so it moves the return and the cash but never the income a buyer caps or the exit value.

Other income

Pylon signage, storage, parking, antenna, percentage rent you bill separately. Anything that is not base rent or a recovery.

Operating cash flows by year

Equity cash flows: equity at closing, cash flow through the hold, net sale proceeds

What it costs

Acquisition basis

Purchase price--
Closing costs--
Tenant improvement allowance--
Landlord work--
Leasing broker fee--
Capital work funded at closing--
Construction funded at closing--
Total project cost--
Loan fee--
Cost per SF--
Loan proceeds--
Equity required--

Sources and uses

The income

Recoveries by tenant

Year-one reimbursements by tenant, on each lease’s own terms and each renewal’s and replacement’s: its full share of what the leases can bill, what vacancy and downtime leave with the landlord, what the lease does not pay, what its cap, stop, base year or fixed charge holds back, and the admin fee. The reconciliation below runs from the property’s total operating expenses to the recoveries on the cash flow, year by year, with the checks that flag a lease and a recovery that do not agree.

The expenses

CAM, taxes and insurance per SF

Operating expenses per square foot by year, what the leases bill back, and the net cost the landlord carries. Recoveries follow each lease as the roll states it: pro rata shares, admin fees, caps and management terms

Apartment operating expenses

The residential lines by year, per unit and in dollars, from the figures entered under Expenses. Taxes grow at the tax growth rate and every other line at expense growth, unless a year is overridden under Expense changes by year

Planned capital, below the NOI line

Capital expenditures by year, in dollars and per square foot. Capital is not an operating expense and is not deducted in arriving at NOI: the operating lines sit in the tables above. Year 0 is funded at closing and included in the basis; the cash flow statement draws the capital by year beside the income

The debt

How the loan sized

Proceeds are sized to the most restrictive of the lender’s tests. The binding constraint is marked; the others carry headroom.

Prepayment, maturity and the cost of the debt

Yield maintenance and defeasance are approximated from the spread forgone over the remaining term, an order-of-magnitude estimate for screening. The loan documents govern.

Covenants year by year

A covenant breach typically triggers a cash sweep rather than a default: distributions are trapped until the ratio is restored.

Cost of debt

All-in rate by year, after the cap and the floor

Debt service coverage by year

Amortization schedule

Coverage and amortization. Coverage shows whether each year clears the lender’s floor; the schedule shows the balance outstanding at sale. An interest-only period improves the former and leaves the balance unchanged.

The return

The numbers

Per square foot and per unit, at entry and at exit. All figures derive from the same calculation as the tables below.

Scenario analysis

Down, base and up on the assumptions that move this deal: rent, the exit cap, vacancy, the rate and the timing. Move any input and all three move with it.

Deal metrics

Annual summary

Return on cost is each year’s NOI over the cost before financing, the yield on cost’s basis; the multiple to date is the cash back to the equity so far, over the equity.

Development spread

Stabilized NOI--
Yield on cost--
Exit cap rate--
Development spread--
NOI growth, CAGR--
WALT--
Stabilized DSCR--
Year-one debt service--

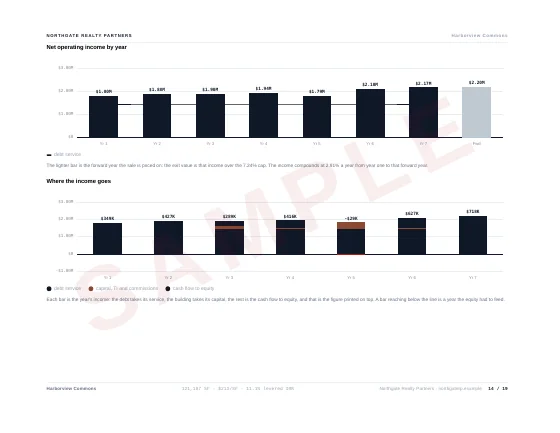
NOI by year

The sale

Forward NOI at sale--
Sale price at exit cap--
Less cost of sale--
Less loan payoff--
Net proceeds to you--
Total profit over the hold--
Unlevered IRR--
Net present value--

Price at target return

An asset with vacancy is priced on stabilized income capitalized, less the cost to stabilize and the return required for the risk, not on in-place income. Set the target return; the price follows.

Cash flow statement

Every year of the hold in one statement, in dollars or in thousands.

Testing it

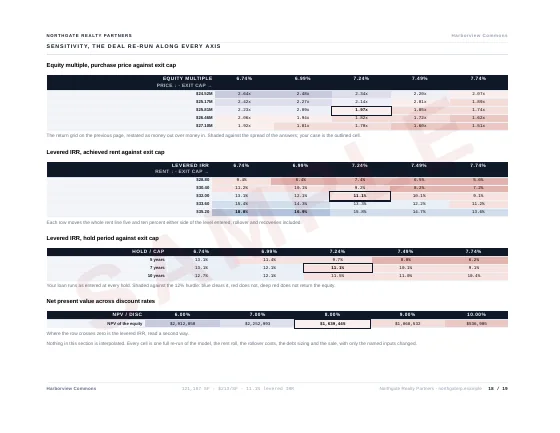
Return sensitivity

Levered IRR across purchase price, 2.5 and 5 percent either side, and exit cap. Base case outlined · red: below the discount rate blue: clears it

Scenario analysis

Each column is a full recalculation of the model, not a haircut applied to the base case.

What moves the return most

Basis points of levered IRR between the downside and upside cases, ranked. The ranking depends on the size of each shock; the tested range is shown beside each driver and can be widened.

Hold periods side by side

The model recalculated at each hold period with all other assumptions held: only the hold and the income at sale change.

Waterfall

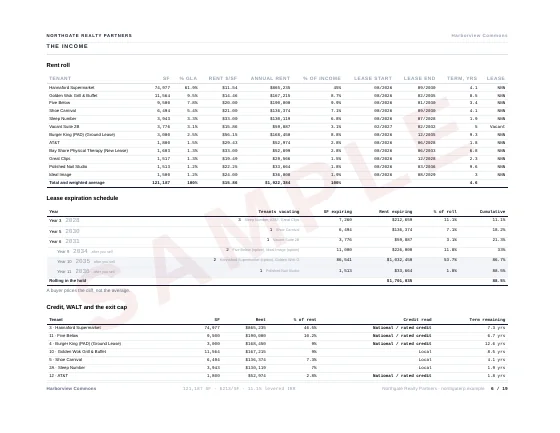
Lease expiration schedule

Leases rolling in each year of the hold, as a share of the leased area and of base rent, the cumulative on rent. Concentrated expirations are priced, not averaged.

What happens at each roll

Every lease expiring within the hold and its treatment: renewal probability, renewal rent, new-lease rent after downtime and tenant improvements, and the rent expected after rollover. The document’s market rent is the starting point; the model’s renewal probabilities and floors are the underwriting.

Renew or replace

One expiring lease, priced two ways from the same closing date to the same exit: the tenant renews, or it leaves and the space is re-let after downtime. Allowances and commissions are dated to the new lease, the sale value moves with the income the buyer inherits, and the answer is the difference in present value, with the rent, allowance and downtime at which the two break even.

Credit, WALT and the exit cap

Credit and term drive the cap rate. Two physically identical assets trade at different cap rates on the credit behind the rent and the term it is contracted for. National credit on a long weighted average lease term compresses the cap a buyer will pay; local credit or a short WALT expands it. The read above is this roll's profile, priced in basis points on your own exit.

Occupancy cost

Where this deal breaks

Each figure is the whole model re-run with one input moved and the rest held. The two right-hand columns are solved: the level of each input at which the levered return falls to the target, and the level at which the equity comes back with nothing on it.

NNN Acquisition

Single tenant, net lease. Buy the income, ride the bumps, sell it to the next guy.

Levered IRR / Equity multiple

--

Equity at closing, cash flow through the hold, net sale proceeds

What you are buying

Purchase price at the going-in cap--
Buy-side broker fee--
Closing costs and diligence--
All-in basis--
Loan proceeds--
Loan fee--
Equity required--
Effective going-in yield on basis--

Sources and uses

Deal metrics

Annual summary

Return on cost is each year’s NOI over the cost before financing, the yield on cost’s basis; the multiple to date is the cash back to the equity so far, over the equity.

The income

Year-one rent--
Rent in the final year--
Year-one debt service--
Year-one DSCR--
Year-one cash-on-cash--
Average cash-on-cash over the hold--

The sale

Forward NOI at sale--
Lease term remaining at sale--
Going-in cap vs exit cap--
Gross sale price--
Sell-side broker fee and closing--
Loan payoff--
Net proceeds to you--
Total profit over the hold--
Unlevered IRR--
Yield on cost, year one--
Cash-on-cash, year one--
Net present value--

Debt service coverage by year

Amortization schedule

Coverage and amortization. Coverage shows whether each year clears the lender’s floor; the schedule shows the balance outstanding at sale. An interest-only period improves the former and leaves the balance unchanged.

Return sensitivity

Levered IRR across going-in and exit cap rates. Base case outlined · red: below the discount rate blue: clears it

Scenario analysis

Each column is a full recalculation of the model, not a haircut applied to the base case.

What moves the return most

Basis points of levered IRR between the downside and upside case, ranked. The order depends on how hard each driver is hit. The tested range sits beside each one, so widen a shock you think is understated and the ranking will move.

Where this deal breaks

Solved against the discount rate; all other assumptions held.

Cap rate drift is the whole game. Buy at a 6.5 and sell at a 7.5 and you hand back years of rent bumps. The spread line above tells you which way the deal is leaning before you look at anything else. On a flat-rent lease with no bumps, every basis point of exit cap expansion comes straight out of your equity.
Term remaining is what a net lease buyer actually prices. A 15-year lease with 12 years left trades at one cap rate; the same building with three years left trades far wider, because the buyer is underwriting a re-tenanting, not an income stream. If your hold takes the lease under about five years remaining, the exit cap in this model is optimistic no matter what the market is doing.
What is not modeled: tenant credit, landlord obligations that survive a "true" NNN (roof and structure are often carved out), percentage rent, and the reassessment that usually follows a sale. If the lease has under five years left, this is not the right tool. You are buying a re-tenanting problem, not an income stream.

Refinance and Cash-Out

What will the new loan pay off, and what comes back to you?

Cash out after payoff and costs

--

New proceeds against what has to come out of them

How big the new loan can be

Value at today's cap rate--
Constrained by LTV--
Constrained by DSCR--
Constrained by debt yield--
New loan proceeds--

Where the money goes

Existing loan payoff--
Prepayment penalty--
Origination, legal, appraisal, title--
Cash to you--
Tax on the cash out--

What you are left holding

Old annual debt service--
New annual debt service--
Change in annual cash flow--
New DSCR--
New debt yield--
New LTV--
Return on the cash you pulled out--
A cash-out refinance is not income, it is borrowed money, which is exactly why it is untaxed, and exactly why it is dangerous. You are trading current cash flow for a lump sum and a bigger obligation. The line to watch is the change in annual cash flow: if it goes deeply negative and the property has no rent growth ahead of it, you have converted a stable asset into a levered bet on the next appraisal.
On prepayment: agency and CMBS debt often carries yield maintenance or defeasance rather than a flat percentage, and the cost can dwarf the fee modeled here. Check the loan documents before you assume a refinance is available at all.

Equity Waterfall

Whose money, whose promote. How a deal's profit actually splits between LP and sponsor.

LP net IRR / Sponsor IRR

--

Where each dollar of profit lands

The capital

Total equity--
Limited partner contribution--
Sponsor co-investment--
Total distributions over the hold--
Total profit--

The split

Return of capital to LP--
Preferred return paid--
Unpaid preferred still accrued--
Split above the pref--
To the limited partner--
To the sponsor--
Sponsor promote earned--
Sponsor share of profit--

What each side earns

LP equity multiple--
LP IRR--
Sponsor equity multiple--
Sponsor IRR on co-invest plus promote--
Deal-level IRR before the split--
How to read the gap. The distance between the deal-level IRR and the LP IRR is what the sponsor's promote costs the investor. A 3-4 point gap on a strong deal is normal and is what pays a sponsor to find and run it. A large gap on a mediocre deal means the structure, not the real estate, is doing the earning.
Modeled here: a cumulative, non-compounding preferred return, return of capital, then a straight promote split above the pref. Real agreements add catch-up provisions, IRR-based tier hurdles, clawbacks, fees paid to the sponsor before any of this runs, and different treatment of operating cash versus sale proceeds. Sponsor fees, acquisition, asset management, disposition, usually matter more than the promote and are not modeled. Read the operating agreement.

Security Deposit Settlement

Work out what you owe the tenant, itemize what you are keeping, attach the receipts, and export the statement.

The tenancy

The deposit

Deductions

Put the exhibit letter beside anything you have a receipt for.

Receipts and invoices

Images and PDFs. Nothing is uploaded, files stay in this browser and print with the statement.

No receipts attached yet.

Statement of Security Deposit Disposition

Complete the tenancy details above

Balance due to tenant

--

Landlord signature and date
Method of delivery and date sent

Before you send it

Interest working

Deadline

This is a calculator and a form, not legal advice. Security deposit law is state law and it varies enormously, whether interest is owed at all, at what rate, how quickly the balance must be returned, what an itemisation must contain, and what happens if you get it wrong. Several states impose double or treble damages for a late or incomplete return. Set the rate and the deadline from your own state’s statute or your attorney’s advice, not from the defaults here, and check them each year.
What you generally cannot deduct. Ordinary wear and tear is not damage: faded paint, worn carpet in traffic lanes, small nail holes and loose fixtures come out of your return, not the deposit. Deductions usually need to be itemized in writing with actual cost, which is what the exhibit column and the attachments are for. A receipt attached to the statement is the difference between a deduction that holds up and one that does not.
Nothing here leaves your browser. The tenant’s name, the address and every file you attach stay on this device. There is no upload, no account and no server. Export the statement as a PDF, and the exhibits print with it.

Net Effective Rent

A $15 deal isn't a $15 deal. Strip out the TI, the commission and the free months.

Net effective rent

--

Face rent vs what you keep, per SF per year

The arithmetic

Total base rent over the term--
Less free rent--
Less tenant improvements--
Less leasing commission--
Less other concessions--
Net effective total--

Per square foot, per year

Face rent, year one--
Average face rent over term--
Net effective, straight line--
Net effective, present value--
Upfront cost to you--
Months of rent to earn it back--

What the concession package costs, per SF

Why this matters: two offers at the same face rent are rarely the same deal. A tenant asking $15 with $40 of TI is offering you less than one asking $13 with nothing. This is the number to feed into a cap rate. Not the face rent.

Rental Property

Residential. Does it cash flow after everything, or does it just look like it does?

Monthly cash flow

--

Where the rent goes, per month

Every dollar of rent, and where it goes

Each line as a share of gross scheduled rent

The screening numbers

Assessed value--
Property tax at that millage--
Cash flow per year--
Net operating income--
Cap rate--
Cash-on-cash return--
Total cash in--
DSCR--
Break-even rent--

If you hold it the full period

Value at exit--
Equity at exit--
Net sale proceeds--
Levered IRR--
Equity multiple--
Net present value--
Expense growth is set above rent growth on purpose. Insurance and reassessed taxes have outrun rents in most markets, and a pro forma that grows both at the same rate quietly manufactures returns. If cash flow is thin today and expenses compound faster than rent, year seven is negative. The projection above will show you the year it turns.
On millage: most assessors quote a millage rate rather than a percentage. One mill is $1 of tax per $1,000 of assessed value, so 12.5 mills is 1.25%. Assessed value is often well below what you paid, some states assess at a fixed ratio, and many reassess on sale, which is the single most common way a rental pro forma turns out wrong in year two.
The 1% rule says monthly rent should be at least 1% of price. It has been near impossible in most US markets since 2021, so treat a miss as a prompt to check the other numbers. The 50% rule says expenses eat about half of gross rent before the mortgage, if you're far under, you probably forgot capex.

Depreciation and tax

Straight-line on the improvements only. A screening estimate, not a tax return. No bonus depreciation, no cost segregation, no passive-loss limits, no recapture on sale.

•Cap Rate •Loan Sizing •Underwrite a Deal •Refinance •Equity Waterfall •Affordable ARGUS Alternative contact@cremodel.com

If this saved you an afternoon in Excel, send it to someone who would use it, copy the link.

Fifteen templates to start from, and a worked sample

Every one of these opens the model already filled in with realistic numbers for its kind of building: a rent roll, allowances, a capital plan, a reassessment and a loan, at 123 Main Street. Type your own deal over it and the whole thing re-runs. Nothing is saved to a server until you save it.

Cedar Bend Crossing, the sample deal

27,000 SF Texas strip center, 15 tenants, fully worked

A finished underwrite to read before you run your own: a Round Rock strip center with national credit beside local operators, a real rent roll with lease dates and escalations, debt sized and priced, and a five-year hold underwriting to a 12.4% levered IRR and 1.71x. Open it and every assumption is standing where the engine left it; change anything and it re-runs. The Excel workbook and the report samples on this page are printed from this exact deal.

Open the sample deal →

Six-unit apartment house

Two one-beds, four two-beds, a coin laundry, a bank loan at 75%

The first building most people buy, set up the way a small-town six-unit actually runs: rents of $1,150 and $1,425 a month, the owner paying water, sewer and the common electric, taxes and insurance per unit, a third-party manager at 6%, a 30-year bank loan at 75% of price. Turnover is priced at the make-ready and the three weeks the unit sits empty. Type your rents, your taxes and your price over these and the return, the coverage and the cash flow re-run as you go.

Entry cap 6.79% · stabilized DSCR 1.36x · levered IRR 10.2%

Open it in the model now →

Vacant pharmacy box

13,000 SF dark drugstore, demised into three suites

The pharmacy chains have left thousands of these behind. The boxes run 7,000 to 14,000 square feet, and the users taking them are discount retail, medical and thrift rather than another pharmacy. This template demises the box into a discount variety anchor, an urgent care clinic and an end-cap coffee unit, with the demising cost, the landlord work and a second-generation allowance on each suite. The number to watch is the development spread: yield on cost against your exit cap.

Yield on cost 8.95% · exit cap 7.50% · spread +128 bps · levered IRR 9.2%

Open it in the model now →

Strip center, two pads and shops

25,275 SF, two credit pads, nine shops, one dark restaurant

A stabilized center with two credit pads carrying the income and nine shops carrying the risk. The pad rents and lease structure follow a 2025 Brevard County trade: a fast casual restaurant at 2,350 SF and a national bank branch at 3,425 SF, both on fifteen-year corporate leases with 10% increases every five years. One 2,400 SF former restaurant is dark and carries a real second-generation restaurant allowance at $45 a foot, four months free and a 6% commission. So you can see what one vacancy actually costs.

Entry cap 6.30% · stabilized DSCR 1.37x · levered IRR 9.6%

Open it in the model now →

Grocery anchored center

71,587 SF, 48,387 SF supermarket plus shops and two pads

The anchor pays $10.50 a foot against shop rents of $24 to $55, which is the whole point of the format: the supermarket buys the traffic and the shops pay for it. The anchor lease runs twenty years with percentage rent at 1% over a natural breakpoint, so the overage turns on once sales clear base rent divided by the rate. Anchors typically sit at 50 to 70% of the gross leasable area; here it is 68%.

Entry cap 6.48% · blended rent $18.45/SF · stabilized DSCR 1.47x · levered IRR 8.6%

Open it in the model now →

Mixed use, shops and apartments

12,000 SF of retail below, 26 apartments above

Two income streams that a buyer will price at two different rates. The shops run on a rent roll and per-foot recoveries; the apartments run on a unit mix, turnover and per-unit expenses. The exit prices the retail at 7% and the residential at 5.5%, because averaging the two and applying one cap rate to the total is how mixed use gets mispriced. One loan sits across both.

Blended entry cap 6.77% · two exit caps 7.00% / 5.50% · levered IRR 12.8%

Open it in the model now →

Apartments, 24 units

Market and restricted units, turnover and a full operating statement

Four unit types on their own lines, because restricted units grow at 1.5% and turn over at 18% while the market units grow at 3.5% and turn over at 55%, blending them overstates both the income and the churn. Turnover is priced properly: the make-ready, the leasing fee and the twenty-one days the unit sits empty. Expenses run per unit per year, the way an apartment P&L is actually kept.

Entry cap 5.99% · stabilized DSCR 1.40x · levered IRR 10.1%

Open it in the model now →

Land and build

Raw land, a build-to-suit pad and a four-suite shop building

Buy the land, put buildings on it, lease them and sell. A coffee pad on a fifteen-year corporate lease at $568 a foot to build, and a speculative 6,400 SF shop block at $250 a foot that carries its own leasing risk. Construction, the allowance and the commission all sit in the basis, so yield on cost is measured against what the project actually costs rather than against the land you started with. Nothing earns until it opens.

Yield on cost 7.86% · exit cap 6.75% · spread +111 bps · levered IRR 9.4%

Open it in the model now →

Village center, two shops to lease

53,488 SF, renovated 2024, two vacant shops to lease up

A thrift superstore holds 48% of the area on a fifteen-year lease with 10% steps, a private academy holds another 34%, and six small shops carry the rest. Two suites sit vacant, and their lease-up is the growth story. The anchor concentration is exactly the kind of thing the deal flags call out, and the model prices the re-letting risk instead of hoping.

Entry cap 6.20% · stabilized DSCR 1.50x · levered IRR 8.0%

Open it in the model now →

Fifteen-tenant strip, fully let

27,019 SF, suite numbers and all, marketed at a six cap

Fifteen small tenants, none over 15% of the income, every suite let, and an EV charging license on the side. The catch is the lease terms: one to seven years, so most of the roll turns over inside the hold and the renewal assumptions do the heavy lifting. The template prices the ask against that roll as it stands, which is why the answer is lower than the brochure’s cap rate implies.

Entry cap 6.89% · most of the roll expires inside the hold · levered IRR 13.8%

Open it in the model now →

Urban storefront, lease-up

2,206 SF near a university, bought empty, one lease to sign

The smallest check on this page: one storefront on a college high street, bought vacant, eight months to a signed coffee tenant at $58 a foot with four months free and a real allowance. One lease is the whole deal, so the downtime, the TI and the exit cap do all the work. A clean way to see how the model treats lease-up risk.

Yield on cost 6.34% · exit cap 5.50% · levered IRR 10.2%

Open it in the model now →

City apartment building, 44 units

44 units, five lines of unit mix, a renovation program and Local Law 11

A Manhattan walk-to-the-subway building: market studios through penthouses on one set of assumptions, eight rent-stabilised units on another, growing slower and almost never turning over. Six one-beds renovate for a $450 premium, the facade cycle and the elevator are in the capital plan, and the buy is priced against a tighter exit. Unit numbers ride along on every line.

Entry cap 5.20% · stabilized DSCR 1.55x · levered IRR 8.4%

Open it in the model now →

Drug store on a ground lease

13,225 SF corporate pharmacy, and you own the dirt, not the building

A ground lease pays rent with no expenses against it, so every dollar is margin and the whole deal is the lease term. The pharmacy pays $11.91 a foot with a step coming, and the play is the negotiation in year four: a $100,000 credit buys a fresh twenty-year term, and the exit prices off that term rather than the short one you bought. The model carries the credit as a cash item in the year it lands, so the trade is priced, not assumed.

Entry cap 5.16% · exit 5.00% on the fresh term · five-year hold · levered IRR 4.9%

Open it in the model now →

Mixed use on a ground lease

Shops below, offices above, on land that belongs to someone else

The other side of a ground lease: here you are the tenant, and $153,600 of ground rent comes off the top of the cash flow every year before anyone else is paid. That is why the deal trades around two hundred basis points over the fee deals on this page. The office floors re-tenant on real money, $45 a foot of allowance, and the model shows how much of the headline spread the ground rent and the retenanting quietly hand back over a ten-year hold.

Entry cap 8.30% · exit 8.00% after ten years · levered IRR 11.8% · 1.71x

Open it in the model now →

Distribution warehouse

218,400 SF bulk industrial, two tenants on long NNN paper

The lease maths a warehouse actually runs on. FedEx Ground holds two thirds of the building on a six-year term with 3.5% bumps and a written five-year option, a regional beverage distributor and a flex suite carry the rest, and one rear bay sits dark with a dated lease-up. Expenses are a fraction of retail, so the whole deal is term, bumps, credit and dock doors: exactly the profile the credit and WALT read prices.

Entry cap 6.67% · WALT 7.5 yrs · 65% credit rent · levered IRR 11.1%

Open it in the model now →
Figures are what each template returns on its own assumptions the moment it opens. They are a starting point for your deal, not a forecast for it.

Keeping your work. Save to account keeps the deal, every assumption and the whole rent roll, versioned on every save and there on any device. Copy deal link puts the entire model into a web address: paste it into deal notes, an email or a calendar entry, and whoever opens it sees the deal exactly as it stands, no sign-in needed.

To save a PDF: press Run deal report, then choose Save as PDF as the destination. The working page itself still prints any time with Ctrl+P.

See the plans Buy me a coffee One plan. OMAI Scan, $29.99 a month in the pilot: the reader that builds the model from the offering memorandum, ten a month, with the report and the Excel on your letterhead and the portal. Cancel any time.

Basis of preparation and limitations

What this is. A first-pass screening model. Every figure is derived arithmetically from the assumptions entered by the preparer named on the cover. No independent verification of any input has been performed.

What it is not. This is not an appraisal, a valuation, an audit, a broker’s opinion of value, a fairness opinion or a substitute for diligence. It is not investment, tax, legal, accounting or brokerage advice, and no fiduciary or advisory relationship arises from its preparation or delivery.

What it leaves out. Estimates round. Depending on the model they may omit or simplify: capital expenditure beyond the items scheduled, income and transfer taxes, reassessment on sale, reserves, working capital, entity-level costs, insurance and environmental risk, title and survey matters, zoning and permitting risk, co-tenancy and exclusivity provisions, guarantor covenants, percentage rent audits, and the timing and availability of debt. Depreciation figures ignore bonus depreciation, cost segregation, passive-activity limits and recapture on sale.

Reliance. No person should rely on this document to offer, sign, lend, invest or divest. Verify every figure against the executed leases, the certified rent roll, the operating statements, the title commitment, the survey and the loan documents, and take advice from a qualified attorney, accountant and licensed broker or appraiser.

No warranty and no liability. This document and the tools that produced it are provided as is, without warranty of any kind, express or implied, including any warranty of accuracy, completeness, merchantability or fitness for a particular purpose. To the fullest extent permitted by law, CREMODEL accepts no liability for any direct, indirect, incidental or consequential loss arising from use of these tools or of this document.

Prepared with cremodel.com. All calculations ran in the preparer’s browser; no deal data was transmitted or stored.

These are screening tools, not an appraisal, an audit or a substitute for diligence. They round, they assume, and they leave out things that matter at the diligence stage. Every figure is an estimate produced from the assumptions entered, and is only as reliable as those inputs. Nothing here is investment, tax, legal, accounting or brokerage advice, and no fiduciary or advisory relationship is created by using it. Verify every number against the leases, the rent roll, the title, the survey and the financials before you offer, sign or lend. CREMODEL makes no warranty of accuracy, completeness or fitness for any purpose, and accepts no liability for any loss arising from use of these tools or of any report printed from them. Consult a qualified attorney, accountant and licensed broker or appraiser on any real transaction. Every calculation runs in your browser. A PDF you drop in is sent once for secure OMAI Scan processing and stored nowhere; anything you paste or type is read locally and never uploaded. ARGUS and ARGUS Enterprise are trademarks of Altus Group Limited; CREMODEL is not affiliated with, endorsed by or connected to Altus Group, and is not a substitute for a certified valuation product. © 2026 CREMODEL. All rights reserved.  Terms · Privacy.